
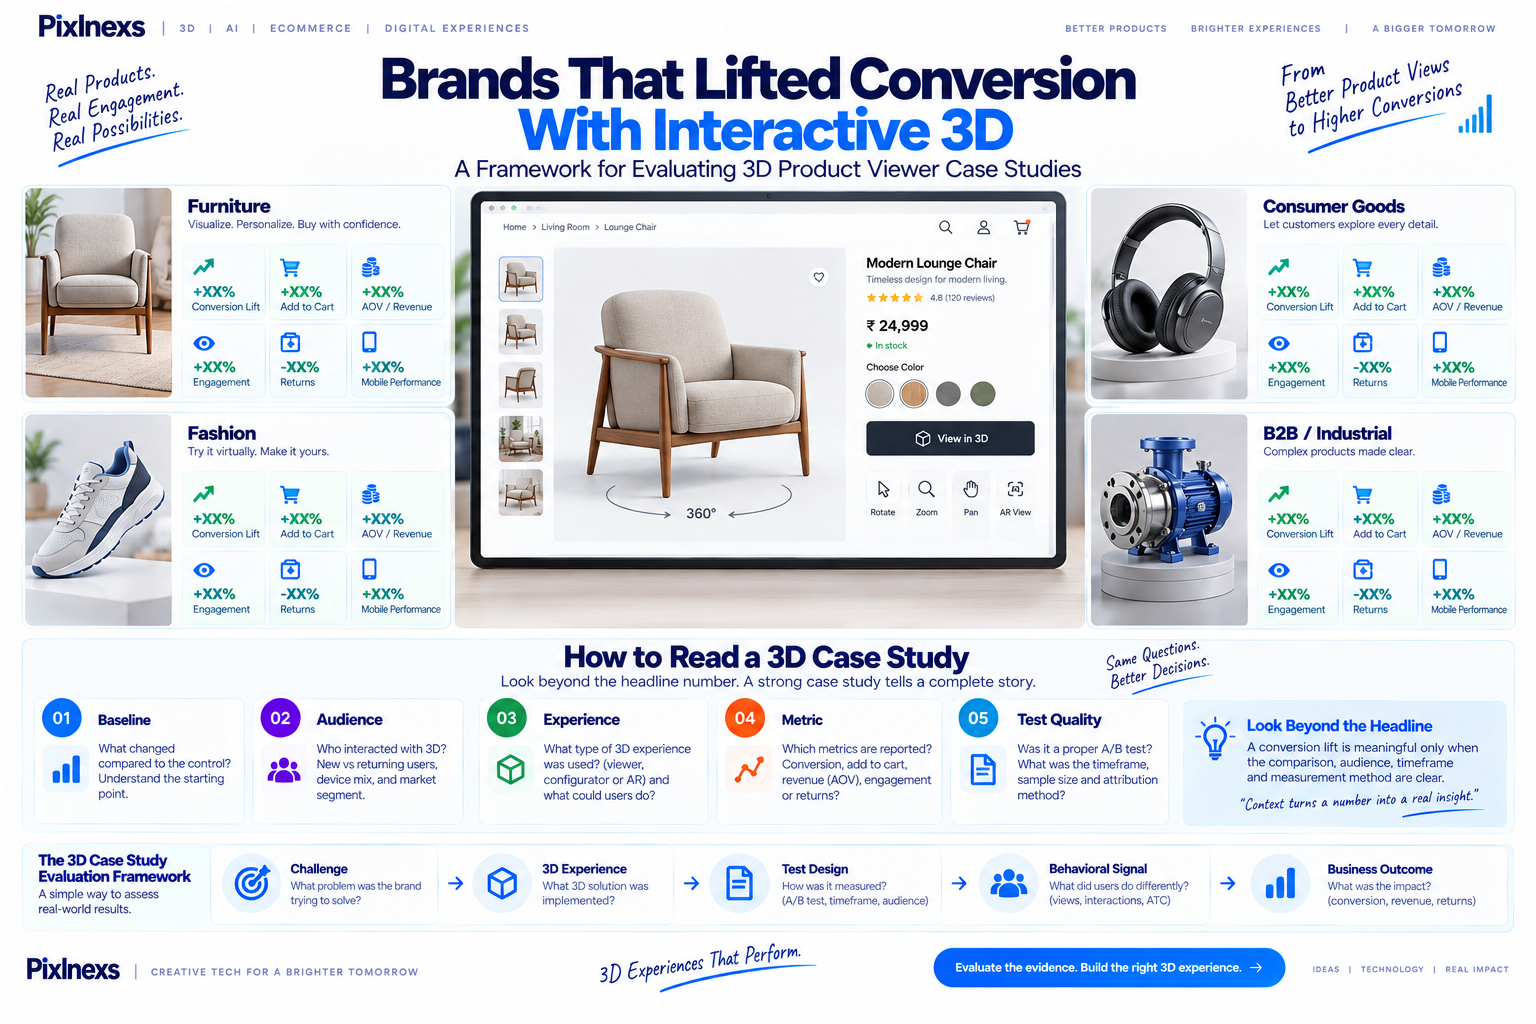
Quick answer: Evaluating 3d product viewer case studies conversion claims requires a strict framework that separates verified outcomes from marketing language. Look for specific metrics add-to-cart rate, average order value lift, return-rate change rather than vague claims of “engagement.” A credible case study discloses its time period, sample size and methodology.
This article is a framework, not a set of results. We have not been supplied with verified, client-approved case study data for this piece so instead of inventing numbers, it lays out the checklist for evaluating any vendor’s claims and a structural template for what real data should look like once it exists.
By Bali Balaji, Pixlnexs Studio. Pixlnexs builds interactive 3D and AR product visualization for eCommerce brands and this piece reflects what our production team looks for when assessing whether a 3D visualization claim is credible.
Editorial note: This is an intentionally incomplete skeleton. It is not a publish-ready results roundup. It should not be presented to a reader as containing real client outcomes and any table below marked as a placeholder must stay marked as a placeholder until Pixlnexs has verified, client-approved data to insert.
Key Takeaways
- Metrics over hype. Ignore “impressive visuals” claims. Focus on add-to-cart rate, average order value, return rate and time-on-page.
- Methodology is what makes a case study credible. A case study without a defined time period, control comparison or sample size is anecdotal, not evidence.
- Return-rate impact is the signal worth the most scrutiny. 3D viewers can reduce returns by letting a buyer verify fit, scale and detail but that only counts if it is actually measured, not assumed.
- Verification steps exist for a reason. Ask for raw data access, third-party analytics confirmation or a live demo of the specific implementation being cited.
- Current status of this article: framework only. Placeholder rows are placeholders. They will be replaced with real, anonymized, verified data as it becomes available not before.
Why Most “Case Studies” Are Marketing, Not Data

Searching for 3d product viewer case studies conversion usually means looking for proof that 3D visualization pays off. The problem is that the market is full of qualitative praise: “customers loved it,” “engagement went up.” These statements are not useless but they are not evidence either and they will not help you build a business case internally.
We have seen vendors present “case studies” that are effectively press releases: a polished render, a claim that “sales increased” and no disclosure of by how much, over what period or against what baseline. That gap between an emotionally compelling story and a verifiable number is exactly what this article is meant to help you close.
This piece will not manufacture that missing data. No verified, anonymized client results have been supplied to us for this specific publication. Instead, it provides the framework for evaluating any case study you encounter the metrics that matter, the questions to ask a vendor and a structural template for what real data should look like once it exists. A separate reference Baymard Institute’s e-commerce UX research is a useful independent source for the kind of rigorous, methodology-disclosed research this framework asks vendors to match.
The Gap Between Engagement and Revenue
A common pitfall is conflating engagement with revenue. A shopper spending ten minutes rotating a 3D model of a watch shows high engagement but if that time does not lead to an add-to-cart action, it has no measurable business value yet and high engagement with low completion can just as easily signal confusion as interest.
When evaluating any 3d product viewer case studies conversion claim, follow the full funnel: did the viewer increase time on the product page (yes, often); did that translate into a higher add-to-cart rate (the real question); did resulting confidence reduce returns (the question that affects net profit most directly)? The next section breaks these down individually.
The Metrics That Actually Matter
Vague terms like “better user experience” are not metrics. Here are the specific, quantifiable metrics a credible case study should report.
| Metric | Definition | Why It Matters for 3D | What to Verify |
|---|---|---|---|
| Add-to-cart (ATC) rate | Add-to-cart events ÷ product page views | 3D detail can reduce uncertainty that suppresses purchase intent | Lift versus a control group and whether the lift is statistically significant |
| Average order value (AOV) | Total revenue ÷ number of orders | Configurators can support upselling and variant-driven price increases | Whether the comparison controls for product mix and price point |
| Return rate | Returns ÷ orders | 3D can reduce “wrong size/wrong expectation” returns | Baseline comparison and impact on net profit, not just gross sales |
| Time-on-page | Total time on page ÷ page views | Signals engagement but only alongside completion metrics | Correlation with ATC rate, not raw time alone |
| Conversion rate | Purchases ÷ visitors | The comprehensive, bottom-line metric | Overall lift, controlled for seasonality and other concurrent changes |
Why Each Metric Needs Context, Not Just a Number
Add-to-cart rate matters because 3D detail can reduce the uncertainty that keeps a shopper from committing but a reported lift only means something next to a genuine control group and a stated sample size large enough to be meaningful.
Average order value can rise because a configurator makes upsells and premium variants easier to select but if the 3D viewer only ever shipped on the highest-priced products in a catalog, an AOV lift may reflect that product mix, not the 3D feature itself. A credible case study controls for this.
Return rate is arguably the most commercially interesting metric, because it affects net profit even when the top-line sale price does not change. It also requires a clean baseline and enough time to see returns actually happen, since returns lag the original sale.
Time-on-page is a useful secondary signal but a poor primary one. High time with a low add-to-cart rate is at least as likely to indicate confusion as fascination.
Conversion rate is the metric that ties everything together but it is also the most exposed to unrelated factors a promotion, a traffic-source shift, a seasonal pattern so it needs the longest and most carefully controlled comparison window of the five.
How to Request and Verify Vendor Case Studies
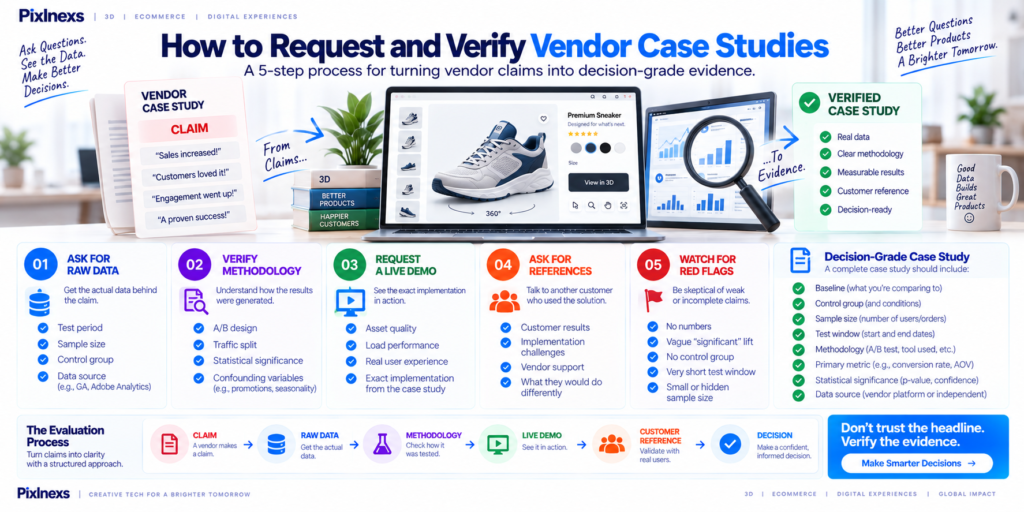
Do not take a vendor’s case study at face value. Work through this sequence before treating any claim as decision-grade.
Step 1: Ask for the Raw Data
Ask for the time period tested, the sample size, whether there was a genuine control group (and what it was) and the methodology used to collect the data the vendor’s own platform or an independent tool such as Google Analytics or Adobe Analytics.
Step 2: Ask for the Methodology
Was it a proper A/B test and what was the traffic split? Was statistical significance calculated or is a small lift being presented as meaningful without that check? Were confounding variables a concurrent promotion, a seasonal spike accounted for?
Step 3: Ask for a Live Demo
A live demo of the exact implementation referenced in the case study lets you judge asset quality, load performance and whether the user experience matches what is being claimed, rather than trusting a screenshot.
Step 4: Ask for References
Speaking directly to another customer who implemented the same solution about the results they actually saw, the challenges they hit and the vendor’s support during implementation is one of the most reliable verification steps available.
Step 5: Watch for Red Flags
Be skeptical of a case study with only qualitative praise and no numbers, vague terms like “significant increase” with no figure attached, no mention of a control group, a very short test window or a small, unstated sample size.
Want your 3D viewer results to actually be verifiable?
Pixlnexs sets up your measurement plan add-to-cart rate, return rate, AOV, conversion rate against a proper baseline from day one.
Talk to PixlnexsStructural Template: What Real Data Should Look Like
Because we are not presenting invented client data in this article, here is the structural template a real, verified case study should follow. Use it to evaluate any case study a vendor sends you and treat every bracketed field below exactly as a placeholder not as a stand-in for a plausible-sounding number.
[Case Study Title: Product Category]
Client: [Case study data pending insert verified client result here] Industry: [Case study data pending insert verified client result here] Time period: [Case study data pending insert verified client result here] Sample size: [Case study data pending insert verified client result here] Control group: [Case study data pending insert verified client result here]
| Metric | Baseline | With 3D Viewer | Lift | Statistical Significance |
|---|---|---|---|---|
| Add-to-cart rate | [Case study data pending insert verified client result here] | [Case study data pending insert verified client result here] | [Case study data pending insert verified client result here] | [Case study data pending insert verified client result here] |
| Average order value | [Case study data pending insert verified client result here] | [Case study data pending insert verified client result here] | [Case study data pending insert verified client result here] | [Case study data pending insert verified client result here] |
| Return rate | [Case study data pending insert verified client result here] | [Case study data pending insert verified client result here] | [Case study data pending insert verified client result here] | [Case study data pending insert verified client result here] |
| Conversion rate | [Case study data pending insert verified client result here] | [Case study data pending insert verified client result here] | [Case study data pending insert verified client result here] | [Case study data pending insert verified client result here] |
Why this template matters: it forces a vendor to provide specific, checkable data across every field. If a vendor cannot fill in a version of this table with real numbers, not adjectives treat that as a reason for skepticism, not as a minor gap.
Common Red Flags in 3D Viewer Claims
- No numbers at all only qualitative praise (“customers loved it,” “huge improvement”).
- Vague magnitude language “significant,” “substantial,” or “dramatic” increases with no attached figure.
- No stated control or baseline a claim with nothing to compare against.
- A suspiciously short test window a claim based on a single week or month, too short to rule out normal fluctuation.
- An unstated or very small sample size a lift reported without any indication of how many users or orders it is based on.
- Selective product examples a single standout product cited as if it represents typical results across a catalog.
Operator Observations: What We See in Production
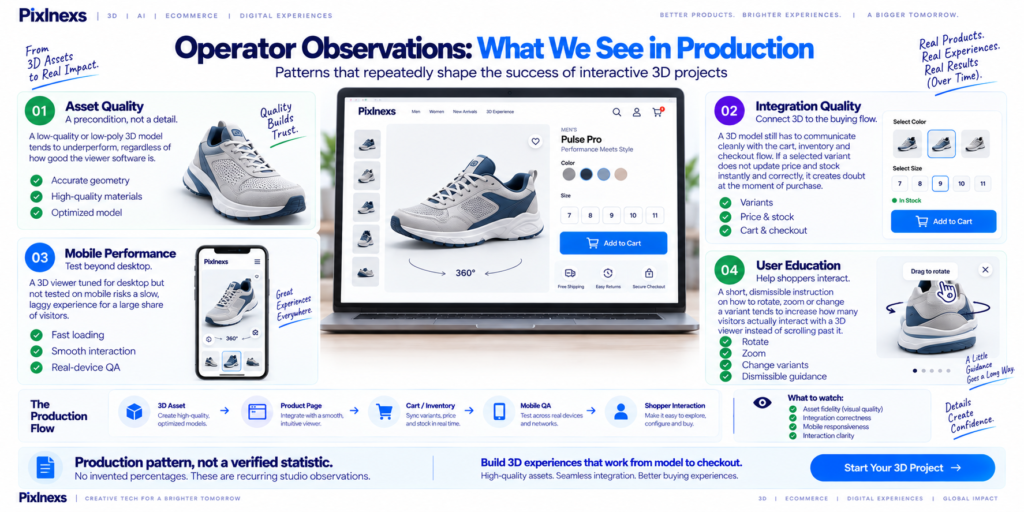
As a studio that builds the 3D assets and integrations behind these implementations, a few patterns show up repeatedly, without our attaching invented numbers to them.
Asset quality is a precondition, not a detail. A low-quality or low-poly 3D model tends to underperform regardless of how good the surrounding viewer software is poor asset quality is one of the more common reasons a 3D initiative disappoints a team that invested in it.
Integration quality is where many projects actually stumble. A beautiful 3D model sitting on a product page still has to communicate cleanly with the cart, the inventory system and the checkout flow. If a shopper’s selected variant does not update price and stock instantly and correctly, the mismatch creates doubt at exactly the moment a purchase decision is being made.
Mobile performance is not optional. A 3D viewer tuned for desktop but not tested on mobile risks a slow, laggy experience for a large share of visitors and a laggy experience is more likely to suppress conversion than a plain static image would have.
User education helps. A short, dismissible instruction how to rotate, zoom or change a variant tends to increase how many visitors actually interact with a 3D viewer instead of scrolling past it.
None of these observations come with a specific percentage attached, deliberately. They describe patterns we see across projects, not a verified, citable result. That distinction is the entire point of this article.
Frequently Asked Questions
What is the average increase in conversion rate from a 3D product viewer?
There is no single, reliable average that applies across products and vendors and treat any source that states one flatly as a red flag rather than a fact. The actual effect depends heavily on product category, asset quality, integration quality and how rigorously it is measured. The right approach is to measure your own baseline and your own controlled test, not to import someone else’s headline number.
How much does it cost to implement a 3D product viewer?
Cost varies widely with the number of products, model complexity and integration depth. A small, single-product pilot costs meaningfully less than a full-catalog rollout with deep e-commerce platform integration. Ask any vendor for a detailed, itemized quote rather than a single all-in figure.
Can I use a 3D product viewer for any type of product?
Technically yes but the return on the investment varies. Products with complex shapes, multiple variants or return rates tied to appearance mismatches tend to benefit the most. A simple, single-variant product with low return rates may see little practical benefit from the added investment.
How do I measure the success of my own 3D product viewer once it launches?
Track add-to-cart rate, return rate and conversion rate for products with the viewer against comparable products without it, over a long enough window to smooth out seasonal noise. Be explicit about your baseline period and be honest about ruling out other changes a promotion, a traffic shift that happened at the same time.
Is a 3D product viewer better than a video?
They serve different purposes rather than competing directly. A video shows the product in motion or in use; a 3D viewer lets a shopper control the exact angle and detail they want to inspect. Many strong product pages use both rather than choosing one over the other.
What is the difference between a 3D product viewer and an AR product viewer?
A 3D product viewer lets a shopper rotate, zoom and inspect a model on screen. An AR viewer places that model into the shopper’s own physical space through a phone camera, answering a fit-or-scale question a screen-only viewer cannot.
Why doesn’t this article include real case studies if the topic demands them?
Because we have not been supplied with verified, client-approved results to publish and inventing plausible-sounding numbers to fill that gap would be a form of fabrication, not content. This article is explicitly a framework and evaluation checklist, to be updated with genuine, attributed results once they exist and have been cleared for publication.
How should I treat this article until real case studies are added?
As a tool for evaluating other people’s claims and as a measurement plan for your own pilot not as evidence of what a 3D viewer will do for your specific business. Once verified results are available, this piece will be updated and the update will be clearly distinguishable from the current framework-only version.
Ready to Build (and Properly Measure) Your 3D Product Viewer?
If you are evaluating a 3D product viewer investment, the most useful thing you can do before committing is apply the framework above to any vendor’s existing case studies including ours, once we have verified results to share. Pixlnexs can also help you set up the measurement plan (add-to-cart rate, return rate, AOV, conversion rate, each against a proper baseline) from day one, so that whatever your own results turn out to be, they are actually verifiable.
Talk to Pixlnexs about 3D product visualization for your store
For the underlying visualization approaches this framework applies to, see Best Interactive 3D Product Viewer Platforms (2026) and Interactive 3D vs 360° Product Photography.










Leave a Reply