
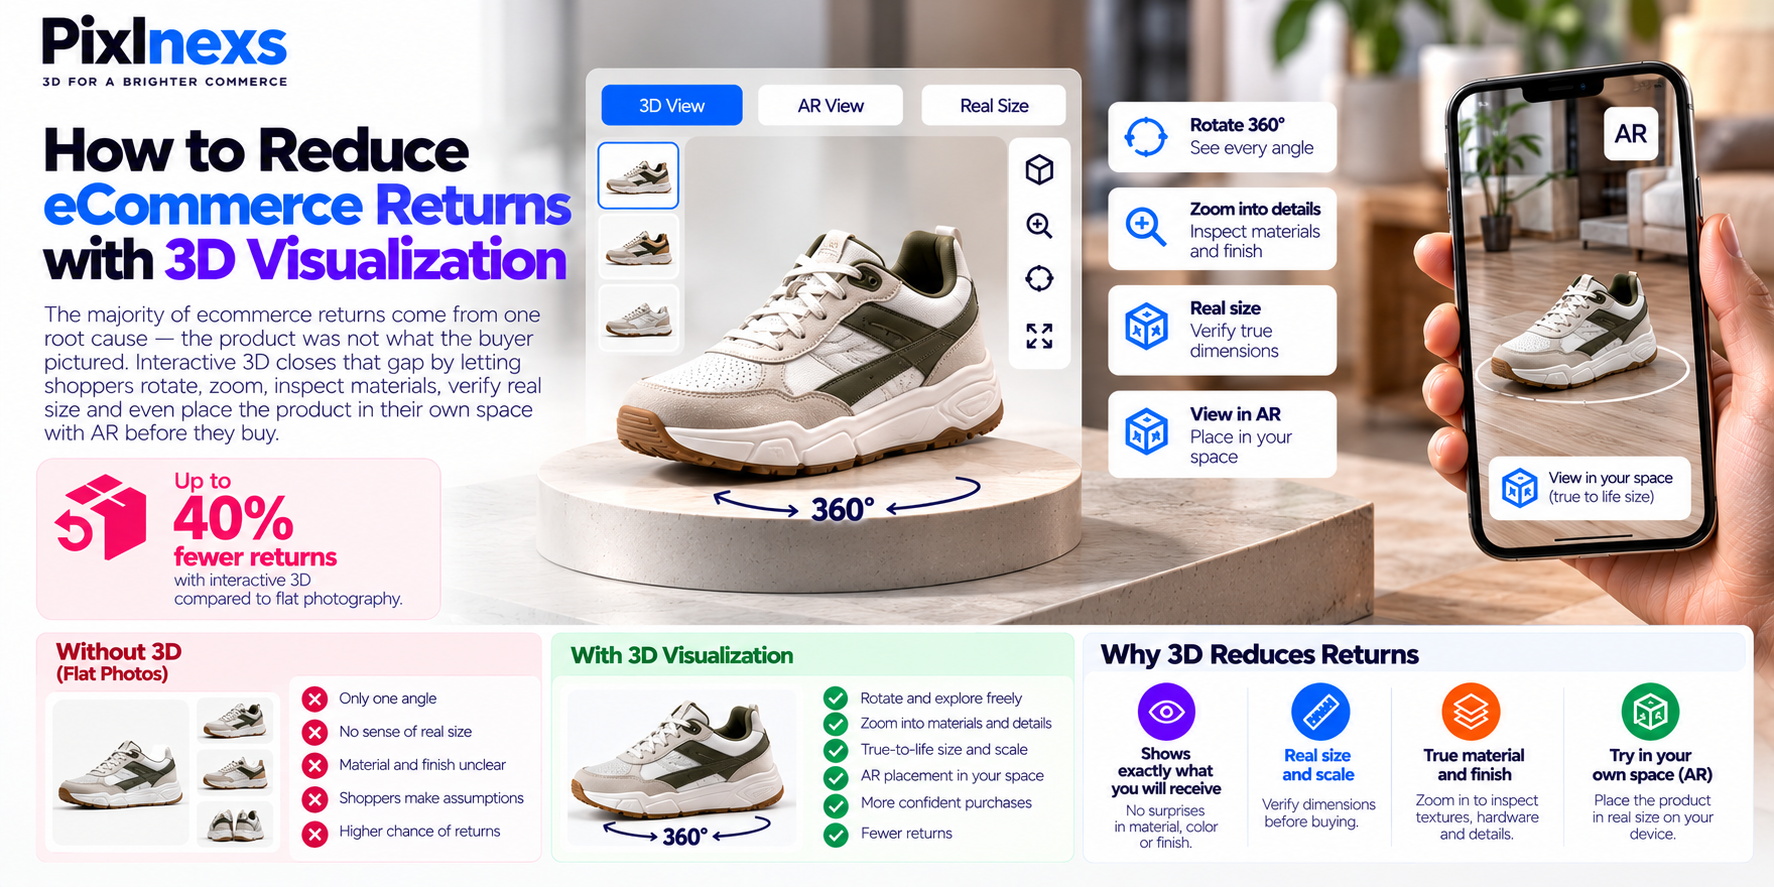
Quick Answer: To Reduce ECommerce Returns with 3D Product Visualization, The majority of ecommerce returns come from one root cause the product was not what the buyer pictured. Flat photography shows one angle, under controlled lighting, at a size the photographer chose and shoppers fill in the gaps with assumptions that are frequently wrong. Interactive 3D closes that gap by letting shoppers rotate a product, zoom into the material and finish, verify real size and in AR-enabled categories place the product in their own space before they buy. Industry and Shopify data put the effect at up to 40% fewer returns compared to flat photography, because the expectation arriving at checkout matches what arrives in the package.
By Manoj, Pixlnexs Studio. Pixlnexs builds interactive 3D and AR product visualization for ecommerce brands across furniture, fashion, beauty, electronics and packaged goods and this guide reflects the return patterns we see across client categories and the specific ways 3D addresses each one.
Key Takeaways
- Returns are a margin problem, not just a logistics inconvenience. The cost of a returned order typically includes outbound shipping, return shipping, restocking labor and a product that may not be resaleable at full price combined, this can exceed the original order margin entirely.
- Most ecommerce returns in non-defect categories trace to three root causes: size or scale was not what the buyer expected, color or finish looked different on screen than in person or a specific detail (a port, a clasp, a seam, a label) was not visible in the product photography and the buyer assumed something incorrect.
- Interactive 3D addresses all three at source, before the purchase, rather than at the return stage after the product has already been shipped.
- Industry data puts the return reduction effect at up to 40% on product pages with interactive 3D viewers compared to static photography alone. Shopify and Vertebrae cite this figure; the actual impact for any specific brand and category will vary with implementation quality.
- The return reduction benefit compounds with the conversion benefit. A page that converts more visitors and generates fewer returns improves unit economics on both sides of the transaction simultaneously.
- Returns are not distributed evenly across a catalog. Most brands have a small number of high-return SKUs that account for a disproportionate share of total return volume and these high-return products are exactly where the ROI case for a 3D model is clearest and fastest to validate.
- AR in-room placement is the most powerful return-reduction tool for furniture, home décor and large appliances, where the dominant return reason is “it didn’t fit” or “it looked different in the space.”
The Real Cost of eCommerce Returns
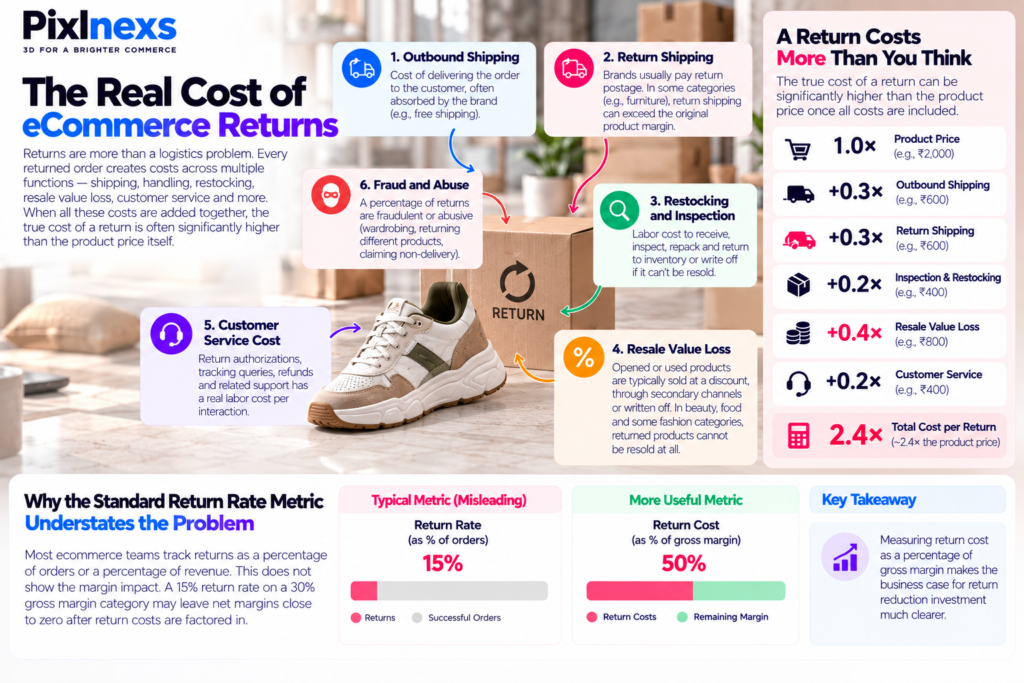
Returns are routinely discussed as a logistics problem an operational overhead to be managed rather than a strategic priority to be reduced. This framing understates the cost. Every returned order generates costs across multiple functions simultaneously.
The Full Cost Stack of a Return
Outbound shipping: the cost of delivering the order to the customer in the first place. This is often partially or fully absorbed by the brand in the form of free shipping promotions.
Return shipping: for most consumer categories, brands now pay return postage to maintain competitive positioning. In some categories (furniture, large appliances) return shipping costs can exceed the original product margin entirely.
Restocking and inspection: the labor cost of receiving the return, inspecting the condition, repackaging and returning it to inventory or writing it off if the product cannot be resold as new.
Resale value loss: products returned in opened or used condition are typically restocked at a discount, sold through a secondary channel at a lower price point or written off entirely. In beauty, food, cosmetics and some fashion categories, returned products cannot be resold at all.
Customer service cost: return-related contact with the customer service team return authorization, tracking queries, refund confirmation has a real labor cost per interaction.
Fraud and abuse: a percentage of returns in most consumer categories are fraudulent or abusive (wardrobing, returning a different product, claiming non-delivery). Reducing legitimate returns does not address this category but it reduces the total return volume that the fraud-and-abuse percentage is calculated against.
When these costs are added together, the true cost of a return in most consumer categories is significantly higher than the face value of the product. In categories with low average order values and high return rates fast fashion being the most extreme example the net margin per order after returns can be negative even on orders that convert.
Why the Industry Standard Metric Understates the Problem
Most ecommerce teams track return rate as a percentage of orders or a percentage of revenue. What this metric does not capture is the margin impact: a 15% return rate on a 30% gross margin category may leave net margins close to zero after return costs are factored in but the return rate metric itself does not make this visible. The most useful reframe is return cost as a percentage of gross margin rather than as a percentage of revenue this makes the business case for return reduction investment considerably clearer.
Why Returns Happen: The Three Root Causes
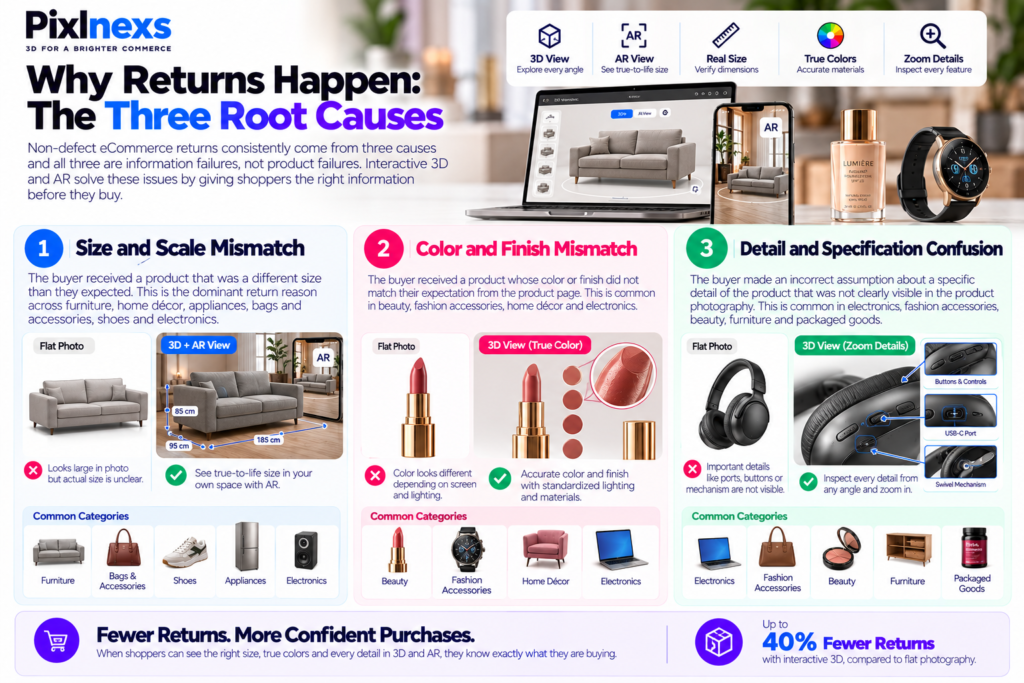
Non-defect ecommerce returns returns that do not involve a damaged or faulty product consistently cluster around three causes and all three are primarily information failures rather than product failures.
Root Cause 1: Size and Scale Mismatch
The buyer received a product that was a different size than they expected. This is the dominant return reason across furniture, home décor, appliances, bags and accessories, shoes and electronics. A sofa that looks like it comfortably seats three in a studio photograph may arrive and look like it barely fits two in the buyer’s living room. A bag that looks substantial in a styled flat lay is actually a small crossbody. A speaker that looks desktop-sized in a hero shot is actually a shelf unit.
Size mismatch is an information problem. The buyer did not have a reliable reference for the product’s actual dimensions relative to their specific space. A text dimensions table in the product description is the conventional answer to this problem and it is consistently insufficient, because converting “W: 185cm × D: 95cm × H: 85cm” into a mental image of how a sofa will look in a room requires a spatial visualization skill that most shoppers do not apply to a specification table during a browse session.
AR placement solves size mismatch better than any alternative, because it removes the visualization step entirely. A shopper who places a sofa model at true-to-life scale in their living room using their phone camera does not need to visualize anything they see it.
Root Cause 2: Color and Finish Mismatch
The buyer received a product whose color or finish did not match their expectation from the product page. This is the dominant return reason across beauty, fashion accessories, home décor and electronics. The foundation shade was slightly more yellow-toned than the photograph suggested. The sofa fabric photographed as a warm medium gray but arrived as a cooler, lighter silver. The laptop’s “midnight blue” finish looked nearly black in the hero shot but arrived as a vivid medium blue.
Color and finish mismatch is also an information problem but it is complicated by two factors that do not apply to size. First, color rendering varies with the viewing device the same product image looks different on a calibrated professional monitor, an uncalibrated laptop screen, a phone screen with saturated color settings and an older tablet with a cool backlight. Second, beauty product photography in particular is routinely processed to present shades in the most flattering light rather than the most accurate one.
A 3D model with correctly calibrated PBR materials and standardized color code inputs renders the product’s actual color under a standardized lighting environment rather than under a photographer’s choice of lighting and that standardized color is closer to what arrives in the package than a retouched photograph is.
Root Cause 3: Detail and Specification Confusion
The buyer made an incorrect assumption about a specific detail of the product that was not clearly visible in the product photography. This is the dominant cause of electronics returns (wrong port type assumed) fashion accessory returns (clasp mechanism different from expected) beauty returns (applicator type was different) furniture returns (assembly mechanism was more complex than expected) and packaged goods returns (product volume or concentration was different from expected).
A 3D model that lets a shopper inspect every visible surface of the product including the back panel with technical specifications, the underside where the ventilation slots are, the interior of a bag or the mechanism of a compact closure removes the assumption gap. The shopper either finds the answer to their specific question in the viewer or zooms in far enough to determine it is not visible, at which point they ask a pre-purchase question rather than ordering and returning.
How Interactive 3D Closes Each Return Gap
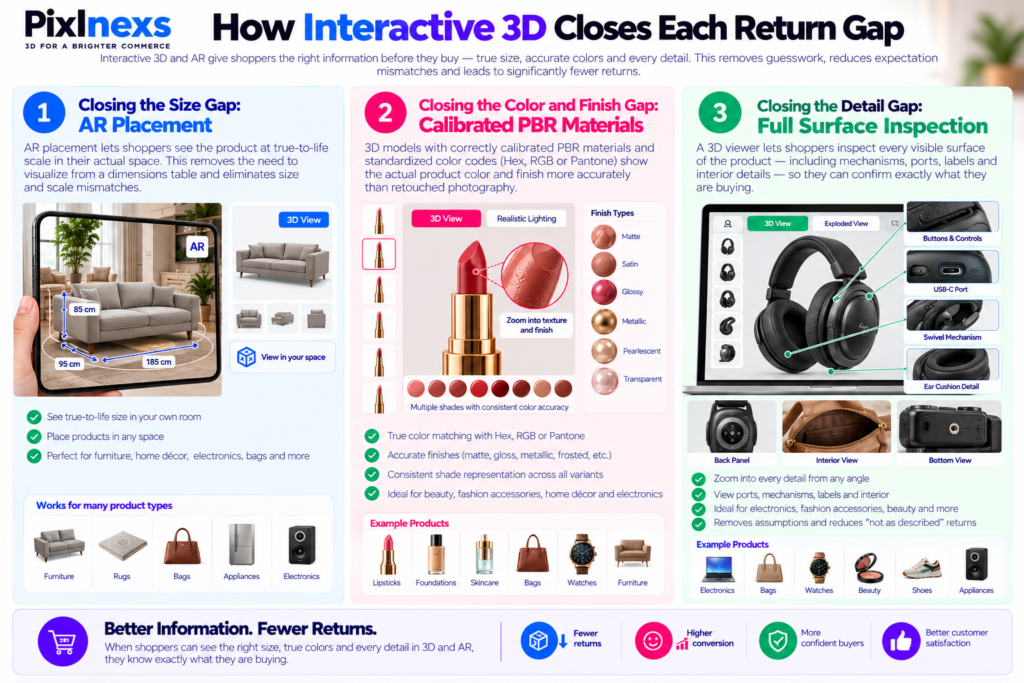
Closing the Size Gap: AR Placement
AR placement is the most direct intervention for size and scale mismatch because it operates in the shopper’s actual physical space rather than asking them to transfer information from a specification table to a mental image.
For furniture and large home décor, AR placement lets a shopper see a sofa, a dining table, a bookcase or a rug at true-to-life scale in their actual room, positioned where they intend to put it. A sofa that fits comfortably in the rendered room and a sofa that clearly overwhelms the space give the shopper real information rather than a specification they have to interpret.
For smaller products accessories, beauty packaging, electronics a 3D model at correct scale gives an immediate proportional reference. A bag placed next to a known object in a flat shot communicates more about size than a dimensions table. AR placement takes this further: the shopper places the bag on their actual desk or table and sees it at real size.
For the technical detail of how AR delivery works on iOS and Android without an app download, see our guide on native app AR vs WebAR for ecommerce.
Closing the Color and Finish Gap: Calibrated PBR Materials
A 3D model built with correctly calibrated PBR materials under standardized lighting renders the product’s actual color more reliably than a photograph that was shot, processed and color-graded under the specific conditions of a particular photo shoot. The key technical requirement is a color code supplied as part of the brief Hex, RGB or Pantone rather than a color derived from photographic reference alone.
For finish accuracy, the relevant PBR properties are roughness (which determines whether a surface reads as matte, satin, gloss or mirror) metalness (which determines the specular response of metallic surfaces) and transmission (which determines translucency for glass, frosted surfaces and transparent plastics). When these are configured correctly for the actual product finish, the viewer shows what the product looks like in person rather than under a flattering studio light.
For a deeper explanation of how PBR materials and texture baking work in production 3D models, see our guide on retopology and UV unwrapping for 3D scans.
Closing the Detail Gap: Full Surface Inspection
A 3D viewer lets a shopper inspect every visible surface of the product not just the face the photographer chose to show. Every port on a device’s back panel, the inside of a bag’s opening, the mechanism of a compact closure, the label text on the back of a bottle, the weave pattern on a fabric furniture piece. This is the full surface inspection that a physical store provides and that no fixed-angle photograph set can replicate.
For electronics specifically, a shopper who is trying to verify that a device has a specific port type can zoom directly to the relevant face and confirm it visually rather than relying on a specification table that may be incomplete or that lists connectors in terminology they are not certain about. This alone eliminates a significant proportion of “not as described” returns in the electronics category.
Where Return Reduction Matters Most by Category
Furniture and Home Décor
The highest-return category in most ecommerce markets, because the dominant return driver is size and spatial fit and spatial fit is exactly what AR placement addresses most directly. Industry data for furniture 3D and AR consistently shows conversion lift of 2x to 4x compared to flat photography and the return rate improvement is driven by the specific subset of returns where the shopper measured incorrectly or misjudged how the piece would look in their space. AR placement puts the product in the space before purchase and eliminates most of this subset entirely.
For our full coverage of AR for furniture specifically, see our guide on AR try before you buy for furniture ecommerce.
Fashion Accessories and Footwear
Size and scale returns (the bag was smaller than expected, the watch case was larger than expected) color and finish returns (the leather photographed differently from the real shade, the hardware looked silver but arrived gold-toned) and detail returns (the clasp mechanism was different from what the buyer assumed). All three root causes are present in this category and all three are addressed by a 3D model with accurate real-world scale, correct PBR materials and a full surface view.
For our full coverage of 3D for rigid fashion accessories, see our guide on 3D product visualization for footwear, bags and watches.
Beauty and Cosmetics
Shade mismatch is the dominant return driver the product arrived in a different shade than it appeared on screen. This is compounded by the fact that beauty photography is routinely processed to present shades in flattering rather than accurate light, so the gap between the product page and the real product is often built into the standard photography workflow. A 3D model with a color code-calibrated material set renders the actual product shade under standardized lighting and consistently reduces shade-driven returns.
Electronics and Gadgets
Port confusion, size surprise and finish color mismatch are the three dominant return causes. A 3D viewer that shows every port and connector, the product at correct AR scale and the finish color accurately under standardized lighting addresses all three. For electronics in particular, the detail inspection use case is the most valuable shoppers buying devices have specific technical questions about what connections are available and a viewer that lets them inspect the port cluster from any angle removes the guess-and-return cycle.
Packaged Goods and Food
Volume and size surprise (the product was smaller than expected) label information confusion (the buyer assumed a specific ingredient or attribute that was not present and not clearly visible in the photo) and color mismatch (the product color through transparent packaging looked different from the photograph). All three are addressed by a 3D model with accurate dimensions, legible label detail at zoom and correct material rendering for transparent and semi-transparent packaging.
Identifying Your Highest-Return Products
Before investing in 3D models for a full catalog, the most efficient approach is to identify the specific products within your range that account for the highest proportion of return volume and start there.
How to Find Your High-Return SKUs
Pull your returns data at SKU level for the last 90 days and calculate return rate by individual product (returns divided by orders, per SKU). In most catalogs, the distribution is highly skewed a small percentage of SKUs account for the majority of return volume. A catalog of 200 products typically has 10 to 20 products that account for more than half of all returns.
Cross-reference the return reason codes or free-text return reasons for your highest-return SKUs. Look specifically for “not as described,” “different from photo,” “wrong size,” “color different from expected” and similar reasons. These are the non-defect expectation mismatch returns that 3D directly addresses. Returns citing “defective,” “damaged in shipping” or “changed mind” are not in the addressable category.
Prioritizing for 3D Investment
Once you have identified your highest-return SKUs and confirmed their return reasons cluster in the expectation mismatch categories, prioritize for 3D investment based on two factors: return rate and average order value. A product with a 25% return rate and a £150 average order value represents a significantly higher return cost than a product with a 25% return rate and a £15 average order value, even though the return rate is identical. The former justifies a higher-quality model investment; the latter may justify a simpler model or a batch treatment.
The fastest proof of concept is a single model on your single highest-return product a before-and-after comparison on your own highest-traffic return-generating SKU gives you the clearest possible signal on whether 3D is working for your category and audience before committing to a larger rollout.
What You Get
Every model Pixlnexs delivers ships as a complete, ready-to-use asset set not a raw file for further processing.
One web-ready GLB file per product, optimized for your storefront’s 3D viewer and for Android AR via Google Scene Viewer.
3 high-quality rendered product images generated from the same 3D source, consistent with the interactive viewer in color, finish and angle.
1 enhanced hero image, a polished, campaign-ready render for the main product page, ad creative or press kit.
A USDZ companion file for iOS AR Quick Look on iPhone and iPad, so the same model works across both major mobile platforms.
Turnaround is typically about 4 working days per product. The same GLB file is the source for the viewer, the renders, the AR placement and any future marketing use one production run rather than separate photography and separate 3D projects.
| Deliverable | Format / Spec | Where It Is Used |
|---|---|---|
| Web-ready 3D model | GLB (glTF 2.0), optimized for web and Android AR | Product page viewer, AR placement, marketplace embeds |
| iOS AR companion file | USDZ | iOS AR Quick Look on iPhone and iPad |
| Rendered product images | 3 high-quality stills generated from the 3D model | Gallery images, marketplace listings, social |
| Hero image | 1 enhanced, campaign-ready render | Main product page, ads, social creative |
| Turnaround | Approximately 4 working days per product | Per-SKU delivery schedule |
Implementation: Getting the Model Live on Your Product Page
Platform Integration
The GLB file embeds on your store through your platform’s native 3D support or a viewer plugin. Shopify has native 3D model support built into product pages, uploading the GLB to the media gallery alongside standard photos activates the interactive viewer automatically. WooCommerce and Magento require a viewer plugin or the Google model-viewer web component. For the platform-specific implementation detail, see our guides on adding a 3D product viewer to Shopify and interactive 3D for WooCommerce and Magento.
Lazy Loading and Page Speed
A 3D viewer added to a product page can hurt Core Web Vitals scores if it initializes eagerly at page load rather than lazily when the shopper reaches the product section. A correctly implemented viewer loads only when a shopper scrolls to the product this means there is no page speed cost to shoppers who bounce before reaching the product and the loading cost is only incurred by shoppers who are actively evaluating the product. We provide lazy loading guidance alongside every model delivery. For the full pre-launch testing checklist, see our guide on how to test 3D and AR product pages before launch.
Measuring Return Rate Impact
The measurement framework for 3D return rate impact is straightforward but requires patience. The correct approach is a before-and-after comparison on a single high-return SKU track the return rate for the 60 to 90 days before adding the 3D model and the return rate for the 60 to 90 days after, on the same SKU with the same traffic source mix. Avoid drawing conclusions from a shorter window, since return rate data lags order date by the customer’s decision timeline and return window length.
A cleaner measurement approach, where traffic volume allows, is an A/B test: split product page visitors between the 3D-enabled version and the flat photography version and compare both conversion rate and return rate across the two groups. This controls for seasonal traffic variation and gives a more precise signal than a before-and-after comparison during a changing period.
Common Pitfalls When Using 3D to Reduce Returns
Building a Model That Is Not Dimensionally Accurate
An AR placement experience where the product renders at incorrect scale is worse than no AR placement; it gives the shopper a misleading spatial reference and increases the likelihood of a size mismatch return rather than reducing it. Exact dimensions are not optional for any model where AR placement or scale impression is part of the value proposition.
Using Incorrect Color Reference
A 3D model built from photographic color reference inherits the color accuracy limitations of that photograph. If the original photography was processed with a warm color grade, the 3D model built from it will render slightly warmer than the real product and will not reduce shade mismatch returns. Color code inputs (Hex, RGB or Pantone) are what allow the model to be calibrated to the actual product shade rather than to the photographed representation of it.
Implementing the Viewer Without Lazy Loading
A product page viewer that loads eagerly can push a page’s Largest Contentful Paint beyond the threshold that both users and search engines penalize. Users who experience slow page loads abandon at higher rates, reducing the conversion benefit of the 3D model before the return reduction benefit even becomes measurable. Lazy loading is not optional for any product page implementation with a 3D viewer.
Starting With the Wrong SKU
Starting with a product that has a low return rate because it is a simple, easily understood product means the return reduction impact of 3D will be small and may not be measurable in the initial measurement window. Starting with a high-return product in an expectation mismatch category the sofa that gets returned because it looked different in the room, the foundation shade that gets returned because it photographed differently gives the clearest possible signal on whether 3D is working for your category and audience.
How to Reduce Ecommerce Returns with 3D Product Visualization
Reducing returns and increasing conversion are usually discussed as separate goals but interactive 3D improves both simultaneously and for the same underlying reason: it reduces the information gap between what a shopper expects and what the product delivers.
A shopper who arrives at checkout with an accurate understanding of what they are buying is more likely to complete the purchase (reduced cart abandonment from uncertainty) and less likely to return the product after it arrives (reduced expectation mismatch). The 94% conversion lift and 40% return reduction figures from Shopify and industry data are two effects of the same cause and they compound on each other. A page that converts more visitors and generates fewer returns improves unit economics twice: more revenue in and less margin eroded by returns.
For brands making the business case for 3D investment internally, presenting both the conversion and the return reduction impact together rather than either one in isolation typically makes the ROI calculation significantly more favorable. A model that costs a few hundred dollars to produce, that drives additional conversions on a high-traffic product page and simultaneously reduces the return rate on that same product, typically pays back within a small number of sales on the conversion benefit alone and the return reduction benefit then represents essentially pure margin recovery.
Conclusion
Returns are not an inevitable cost of ecommerce they are mostly a symptom of information gaps between what a shopper expects and what a product delivers. Interactive 3D closes those gaps at source, before the purchase, rather than managing the cost of the expectation mismatch after the product has already been shipped and received.
The case for starting is straightforward: identify your highest-return product, model it, put it on the product page and measure what happens to your return rate over the next 60 to 90 days. The model cost is recovered quickly on the conversion benefit and the return reduction is pure margin recovery on top.
Send us the product that gets returned most and we will show you how it looks as an interactive 3D model.
Start with your highest-return product
Send us the product that gets returned most and we will show you how it looks as an interactive 3D model and what it does to your return rate.
Get a Quote for Interactive 3D Talk to Our TeamFrequently Asked Questions
Does 3D product visualization actually reduce returns or is this just marketing?
The 40% return reduction figure comes from independent industry research and first-party Shopify data, not from 3D vendor marketing. The directional signal is consistent across multiple studies and across multiple categories. The mechanism is also straightforward: returns from expectation mismatch are reduced when the expectation is more accurately set before purchase and 3D is the most effective tool for setting visual expectation accurately. The actual impact for any specific brand will vary with implementation quality, category and the proportion of returns that are non-defect expectation mismatch rather than damage, fraud or other causes.
Which product categories see the biggest return reduction from 3D?
Furniture and home décor, where AR placement addresses the single largest return cause (size and spatial fit) typically see the largest measurable impact. Electronics and gadgets (detail and specification confusion) beauty and cosmetics (shade mismatch) fashion accessories (size, finish and detail confusion) and packaged goods (size and label detail) all show measurable return reduction when 3D is implemented with accurate dimensions and correctly calibrated materials.
What file format will I receive for my product models?
A web-ready GLB (the binary packaging of glTF 2.0) for your storefront’s 3D viewer and Android AR, plus a USDZ file for iOS AR Quick Look. For a full comparison of these formats, see our guide on GLB vs USDZ vs OBJ: 3D file formats explained.
How quickly can I see a return rate impact after adding a 3D model?
Returns lag order date by the customer’s return window, which varies by category and retailer policy but is commonly 14 to 30 days. A measurable signal in the return rate data typically requires 60 to 90 days of post-implementation data to distinguish a real effect from noise. Starting with your highest-return SKU and measuring carefully over this window gives the clearest early signal.
Do I need AR for 3D to reduce returns or does a standard viewer help?
Both help but for different return causes. A standard interactive viewer (no AR) primarily addresses the color and finish mismatch and detail confusion causes it gives shoppers a better view of the product from all angles under standardized lighting. AR placement additionally addresses the size and scale mismatch cause it puts the product in the shopper’s actual space at real-world scale. For categories where size mismatch is the dominant return cause (furniture, large appliances, large accessories) AR is significantly more impactful than a standard viewer alone.
What do you need from me to get started?
Clear HD photos of the product from every angle, exact dimensions (width by depth by height or diameter for round items) standardized color codes (Hex, RGB or Pantone) and any existing CAD or blueprint files if available. The most important single input for return reduction effectiveness is exact dimensions a model built at incorrect scale will make size mismatch returns worse, not better.
Can I start with just one product rather than my full catalog?
Yes this is the recommended approach. Start with the single highest-return product in your range, model it, measure the before-and-after return rate impact over 60 to 90 days and scale from a position of validated results rather than committing the full catalog budget upfront.
What happens to my SEO if I add a 3D viewer to a product page?
If implemented correctly with lazy loading, a 3D viewer adds no meaningful SEO risk and may improve engagement signals (time on page, reduced product page bounce rate) that search engines observe as quality indicators. An eagerly loading, unoptimized viewer can hurt Core Web Vitals scores. We provide optimized GLB files and lazy loading guidance with every delivery to ensure implementation is correct from the start.









Leave a Reply